

Using Market Insights to Grow Your Fish Farm Profitably

Posted on: 2025-11-10
By: Yomi Adisa
You've spent months perfecting your fish farming techniques, watching your catfish grow healthy and strong. But when you arrive at the market, the prices aren't what you expected. The trader offers 800 naira per kilo for fish you thought would fetch 1,200. Your neighbour's farm is selling the same species at different times and getting premium prices. What's the difference?
The answer lies in market insights—the business intelligence that separates profitable fish farms from those barely breaking even. Market insights aren't just about knowing current prices; they're about understanding demand patterns, timing your production cycles, and positioning your fish where buyers actually want them. When you have this knowledge, you can plan production around peak demand periods and avoid flooding markets when prices drop.
In this guide, you'll discover how to gather and analyse market data that directly impacts your profitability. You'll learn to identify which fish species command premium prices in your region, understand seasonal trends that affect buyer behaviour, and use technology to track the metrics that matter most to your bottom line.
You'll also explore how successful farmers in Nigeria and Ghana use market insights to optimise their operational costs and develop marketing strategies that build lasting buyer relationships.
By the end, you'll understand how to transform market data into actionable strategies that increase your profit margins and reduce the guesswork that costs farmers money every season.
What You Will Learn
- How to gather and analyse market data to enhance profitability.
- Insights into buyer behaviour and seasonal demand patterns.
- Strategies for optimising production cycles to maximise revenue.
- Ways to leverage technology for effective market insight analysis.
- Essential KPIs to monitor and improve farm profitability.
Understanding Market Insights in Fish Farming
You cannot manage what you don't measure, and in fish farming, market insights are your measurement tools for profitability. Most farmers focus entirely on production—water quality, feed conversion, growth rates—while ignoring the market intelligence that determines whether those healthy fish translate into healthy profits. Market insights bridge the gap between successful production and successful business outcomes.
The difference between a farmer earning ₦800 per kilo and one earning ₦1,200 for identical fish often comes down to market knowledge. The profitable farmer knows when demand peaks, which buyers pay premium prices, and how to time production cycles to hit those profitable windows. Without this intelligence, you're essentially farming blind, hoping your production timing aligns with market demand.
Market insights in fish farming encompass everything from understanding buyer preferences and seasonal demand patterns to tracking competitor pricing and identifying emerging opportunities. This isn't academic research—it's practical business intelligence that directly impacts your cash flow and determines whether your next harvest generates profit or disappointment. Understanding fish market trends in Africa helps you position your farm for maximum profitability.
Definition of Market Insights
Market insights are the actionable intelligence you gather about your buyers, competitors, and market conditions that help you make profitable business decisions. In fish farming, this means understanding who buys fish in your area, what they're willing to pay, when they buy most, and what factors influence their purchasing decisions. It's the difference between guessing and knowing.
Think of market insights as your business radar system. Just as radar helps pilots navigate through clouds and storms, market insights help you navigate through price fluctuations, seasonal changes, and competitive pressures. You're not just collecting information—you're gathering specific intelligence that guides your production planning, pricing strategies, and sales timing.
Key Components of Market Insights
- Buyer behaviour patterns: When do your customers buy most? What sizes do they prefer?
- Price trend analysis: How do prices fluctuate throughout the year in your market?
- Competitive intelligence: What are other farmers producing, and how are they pricing?
- Demand forecasting: Which species and sizes will be in highest demand next season?
- Supply chain insights: How do products move from farm to final consumer?
Importance of Market Insights for Profitability
Your production costs remain relatively fixed—feed, labour, utilities—but your revenue depends entirely on market conditions you can predict if you have the right insights. A farmer in Ogun State discovered this when he started tracking buyer patterns at Ketu Market in Lagos. Instead of harvesting whenever his fish reached market size, he began timing harvests to coincide with peak demand periods, increasing his average selling price by 35%.
Market insights help you avoid the costly mistake of producing what you think the market wants instead of what buyers actually purchase. You might assume larger fish always command higher prices, but market data might reveal that medium-sized fish sell faster and generate better cash flow. This intelligence prevents you from holding fish longer than necessary, reducing feed costs and mortality risks.
The profitability impact extends beyond pricing. Market insights help you optimise your entire operation—from species selection and production timing to marketing strategies and buyer relationships. When you understand market dynamics, you can plan production cycles that align with demand peaks, negotiate better prices with buyers, and identify opportunities that other farmers miss.
Types of Market Data Relevant to Fish Farming
You need to track several categories of market data to build a complete picture of your business environment. Price data forms the foundation—not just current prices, but historical trends that reveal seasonal patterns and help you predict future movements. A farmer tracking catfish prices in Ibadan markets discovered that prices typically spike 40% during Ramadan and Christmas seasons, allowing him to time production accordingly.
Demand data tells you which species, sizes, and qualities buyers actually want versus what they say they want. This includes tracking sales volumes, buyer preferences, and emerging trends. Consumer behaviour data reveals when people buy fish, how they make purchasing decisions, and what factors influence their choices—information that helps you position your products effectively.
| Data Type | What It Tells You | Business Impact |
|---|---|---|
| Price Trends | When prices peak and drop throughout the year | Optimal harvest timing for maximum revenue |
| Demand Patterns | Which species and sizes sell fastest | Production planning and species selection |
| Competitor Analysis | What others are producing and charging | Pricing strategy and differentiation opportunities |
| Consumer Preferences | Quality factors that influence buying decisions | Product positioning and marketing messages |
Competitive intelligence shows you what other farmers are doing—their production volumes, pricing strategies, and market positioning. This isn't about copying competitors; it's about understanding the competitive landscape so you can identify gaps and opportunities. Supply chain data reveals how fish move from farms to consumers, helping you identify bottlenecks, inefficiencies, and potential direct-sales opportunities that could improve your margins.
Analysing Market Trends for Fish Species
You cannot choose the right fish species for your farm without understanding which ones actually sell profitably in your target markets. Many farmers select species based on production ease or what their neighbours are farming, only to discover that market demand doesn't match their production. The most technically successful farm means nothing if you're producing fish that buyers don't want or won't pay premium prices for.
Market trends reveal which species command the highest prices, experience the most consistent demand, and offer the best profit margins in your specific region. These trends change over time—what sold well five years ago might be oversupplied today, while emerging consumer preferences create new opportunities for farmers who spot them early. Understanding these patterns helps you make species selection decisions based on market reality rather than assumptions.
The key is analysing trends systematically rather than relying on casual market observations. You need to track actual sales data, price movements, and demand patterns over time to identify genuine opportunities versus temporary fluctuations. This analysis becomes your roadmap for production planning and helps you avoid costly mistakes like investing in species that are losing market share.
Identifying High-Demand Fish Species
Catfish dominates most Nigerian markets, but demand varies significantly by region and consumer segment. In Lagos markets, medium-sized catfish (800g-1.2kg) consistently command prices between ₦900-₦1,100 per kilo, while larger fish often sit unsold because most buyers prefer portion sizes suitable for family meals. Understanding these preferences helps you plan production around actual demand rather than assumptions about "bigger is better."
Tilapia shows strong growth in urban markets across West Africa, particularly among health-conscious consumers who prefer its mild taste and perceived nutritional benefits. In Accra's Makola Market, tilapia prices have increased 25% over the past two years as demand outpaces local supply. However, this same species struggles in rural markets where consumers prefer the stronger taste of catfish and consider tilapia "foreign food."
High-Demand Species Analysis
- Catfish: Consistent demand across all regions, premium prices for 800g-1.2kg sizes
- Tilapia: Growing urban demand, 25% price increase in major cities over 2 years
- Mackerel: Seasonal peaks during festival periods, 40% price spikes
- Carp: Niche market with loyal buyers, limited but stable demand
The mistake many farmers make is choosing species based on production convenience rather than market demand. You might find carp easier to raise, but if your local market only buys 50kg of carp weekly while demanding 500kg of catfish, your production choice limits your sales potential. Market analysis reveals these demand realities before you invest time and money in the wrong species.
Seasonal Trends and Their Impact on Sales
Fish consumption patterns follow predictable seasonal cycles that create profit opportunities for farmers who understand them. During Ramadan, catfish prices in northern Nigerian markets typically increase 30-40% as families prepare special meals for breaking fasts. Christmas and New Year periods see similar spikes across Christian-majority regions, with some farmers reporting prices reaching ₦1,400 per kilo compared to ₦900 during regular periods.
Rainy season affects both supply and demand dynamics. Poor road conditions make transportation more expensive, reducing the number of fish reaching urban markets and driving up prices for available stock. However, this same period often sees reduced consumer purchasing power in rural areas as farming families focus spending on crop production inputs rather than protein purchases.
| Season/Period | Price Impact | Demand Drivers |
|---|---|---|
| Ramadan | +30-40% price increase | Special meal preparations, family gatherings |
| Christmas/New Year | +35-50% price increase | Celebration meals, gift purchases |
| Rainy Season | +15-25% price increase | Transportation challenges, reduced supply |
| School Holidays | -10-15% price decrease | Reduced institutional buying, family travel |
School holidays create the opposite effect—reduced institutional buying from schools and restaurants leads to temporary oversupply and lower prices. A farmer in Kumasi learned this pattern the hard way when he harvested 2,000kg of tilapia during August school holidays, only to find prices 20% lower than expected because institutional buyers weren't purchasing their usual volumes.
Understanding Consumer Preferences and Behaviour
Consumer preferences vary dramatically across African regions, and understanding these differences determines your market success. In coastal areas of Ghana and Nigeria, consumers prefer fish with firm texture and strong flavour, making catfish and mackerel popular choices. Inland consumers often favour milder-tasting species like tilapia, particularly in urban areas where people associate mild flavours with "premium" or "healthy" food.
Size preferences also follow regional patterns that directly impact your pricing strategy. Lagos buyers typically want fish in the 800g-1.2kg range because this size feeds a family of four to six people—the average household size in urban areas. Rural buyers often prefer larger fish (1.5kg+) because extended families share meals, and buying one large fish proves more economical than multiple smaller ones.
Visual Guide: Step-by-Step Process to Analyse Market Trends for a Fish Farm
Why it matters: Raw data forms the foundation of all profitable decisions.
What to watch for: Consistent patterns over 3–6 months, not daily fluctuations.
Why it matters: Patterns reveal profit opportunities that random observations miss.
What to watch for: Recurring cycles that repeat annually, monthly, or weekly.
Why it matters: Helps identify market gaps and avoid oversupplied segments.
What to watch for: Production timing that creates supply gluts or shortages.
Why it matters: Reveals how to position your fish for premium pricing.
What to watch for: Changing preferences that create new market opportunities.
Why it matters: Transforms data into profit-generating actions.
What to watch for: Strategies that align your production with identified market opportunities.
Price sensitivity also varies by consumer segment and region. Urban middle-class buyers often pay premium prices for fish they perceive as fresher, cleaner, or more sustainably produced. Rural consumers typically prioritise value—the most protein per naira spent. Understanding these preferences helps you position your fish appropriately and avoid the mistake of trying to sell premium-priced fish to price-sensitive buyers or underpricing fish to quality-focused consumers.
Utilizing Technology for Market Insight Analysis
You can't compete in today's fish farming market using yesterday's methods of tracking prices on scraps of paper and relying on memory to spot trends. Technology has transformed how successful farmers gather, analyse, and act on market intelligence, giving them decisive advantages over competitors who still operate on guesswork and casual observations. The farmers making consistent profits are those who've embraced digital tools to turn market data into actionable business strategies.
The technology gap in African fish farming isn't about having the most expensive equipment—it's about using the right tools to make better decisions faster than your competition. A smartphone with the right apps can provide more market intelligence than a filing cabinet full of handwritten notes. The key is knowing which technologies actually solve your business problems rather than just adding complexity to your operations.
Modern market analysis technology helps you spot opportunities weeks or months before they become obvious to other farmers. When you can predict price movements, identify emerging demand patterns, and optimise your production timing based on data rather than hunches, you transform from a reactive farmer into a strategic business operator who consistently outperforms the market.
Overview of Farm Management Software
Farm management software designed for aquaculture operations can revolutionise how you track and analyse market data. These platforms integrate production records with market intelligence, helping you understand which production decisions generate the highest profits. Instead of wondering why last season's harvest was less profitable, you can identify exactly which factors—timing, species, size, or market conditions—affected your returns.
The best farm management software for African fish farmers combines affordability with functionality that addresses local market conditions. Platforms like AquaManager and FishTrack allow you to record daily prices from multiple markets, track your production costs against market returns, and identify patterns that inform future production decisions. A farmer in Ibadan using AquaManager discovered that his catfish harvested during the third week of each month consistently sold for 15% higher prices than those harvested at month-end.
| Software | Key Features | Monthly Cost | Best For |
|---|---|---|---|
| AquaManager | Market price tracking, production planning, profit analysis | ₦8,500 | Small to medium farms |
| FishTrack Pro | Advanced analytics, competitor monitoring, demand forecasting | ₦15,000 | Commercial operations |
| AgriData Mobile | Basic tracking, mobile-first design, offline capability | ₦3,500 | Startup farms |
| MarketInsight | Real-time price feeds, trend analysis, buyer network | ₦12,000 | Market-focused farms |
The software investment pays for itself quickly when you consider the cost of poor market timing. Missing a price peak by just one week can cost you ₦50,000-₦100,000 on a typical harvest, while the annual cost of comprehensive farm management software rarely exceeds ₦180,000. The key is choosing software that matches your operation size and provides actionable insights rather than just data storage.
Role of Big Data and AI in Fish Farming
Artificial intelligence and big data analytics are transforming how forward-thinking fish farmers predict market movements and optimise production decisions. AI systems can analyse thousands of data points—weather patterns, festival calendars, economic indicators, historical price data—to predict demand fluctuations with accuracy that human analysis cannot match. This isn't science fiction; it's practical technology that's already helping farmers in Kenya and South Africa increase their profit margins.
Machine learning algorithms excel at identifying patterns in complex market data that humans might miss. An AI system might discover that catfish prices in Lagos consistently rise 8-12 days before major religious holidays, giving you advance warning to time your harvests accordingly. These systems can also predict which species will experience demand growth based on changing consumer preferences, economic conditions, and demographic trends.
AI Applications in Fish Farm Market Analysis
- Price prediction models: Forecast market prices 2-8 weeks in advance based on historical patterns
- Demand forecasting: Predict which species and sizes will be in highest demand next season
- Optimal harvest timing: Calculate the best harvest dates to maximise revenue per batch
- Competitive intelligence: Monitor competitor activities and market positioning automatically
- Risk assessment: Identify market risks and suggest mitigation strategies
The practical benefit of AI in market analysis is speed and accuracy in decision-making. Instead of spending hours manually analysing market data, AI systems can process information in minutes and highlight the insights that matter most to your profitability. A farmer in Ghana using AI-powered market analysis increased his average selling price by 22% simply by optimising harvest timing based on AI recommendations.
Implementing Data Analytics for Decision Making
You don't need a computer science degree to implement effective data analytics in your fish farming operation. Start with simple metrics that directly impact your profitability: average selling price per kilo, price variations by harvest timing, and correlation between market conditions and your revenues. These basic analytics often reveal insights that immediately improve your decision-making and increase profits.
The key to successful data analytics implementation is focusing on actionable insights rather than impressive-looking charts. Your analytics should answer specific business questions: When should I harvest to get the best prices? Which buyers consistently pay premium rates? How do weather patterns affect market demand in my area? If your analytics can't answer questions like these, you're collecting data without generating business value.
Implementation Guide: Setting Up Market Analytics
Implementation Steps Explained:
1. Data Collection Setup
What it involves: Installing apps, creating spreadsheets, establishing data collection routines
Why it matters to you: Consistent data collection forms the foundation of reliable insights
What to watch for: Missing data points that could skew your analysis and lead to poor decisions
2. Metric Definition Phase
What it involves: Identifying which measurements actually impact your profitability
Why it matters to you: Focusing on relevant metrics prevents information overload
What to watch for: Vanity metrics that look impressive but don't guide profitable decisions
3. Analysis Tool Selection
What it involves: Choosing software or platforms that match your technical skills and budget
Why it matters to you: Right tools make analysis faster and more accurate
What to watch for: Overly complex tools that consume time without delivering actionable insights
4. Insight Generation Process
What it involves: Regular analysis sessions to identify patterns and opportunities
Why it matters to you: Raw data becomes profitable only when converted to actionable insights
What to watch for: Analysis paralysis—spending too much time analysing instead of acting
5. Decision Implementation System
What it involves: Creating processes to act quickly on analytical insights
Why it matters to you: Insights generate profits only when implemented effectively
What to watch for: Delays between insight discovery and action that reduce competitive advantage
Start your analytics implementation with one key question that affects your profitability, then build your data collection and analysis around answering that question definitively. A farmer in Ogun State started by tracking the simple question: "Which day of the week do I get the best prices?" His analysis revealed that Tuesday and Wednesday sales averaged 12% higher prices than weekend sales, leading him to adjust his harvest and delivery schedule for immediate profit improvement.

Optimizing Operational Costs Using Market Insights
Your operational costs determine your profit margins just as much as your selling prices, but most farmers focus entirely on revenue while ignoring cost optimisation opportunities that market insights reveal. Understanding market dynamics helps you identify when to buy inputs at lower prices, which suppliers offer the best value, and how to time your operations to minimise expenses while maximising output quality.
Market insights show you patterns in input costs that can dramatically affect your profitability. Feed prices fluctuate seasonally, labour costs vary by region and timing, and utility expenses can be optimised based on usage patterns that successful farmers have identified. When you understand these cost dynamics, you can plan your operations to take advantage of lower-cost periods and avoid expensive timing mistakes.
The farmers achieving the highest profit margins aren't necessarily those with the highest selling prices—they're often those who've mastered cost optimisation through market intelligence. A farmer spending ₦200 per kilo on feed while selling at ₦1,000 per kilo has better margins than one spending ₦300 per kilo on feed while selling at ₦1,100. Market insights help you achieve both: lower costs and higher revenues.
Feed Cost Management Strategies
Feed represents 60-70% of your total production costs, making feed cost management the single most important factor in your profitability. Market insights reveal seasonal patterns in feed ingredient prices that allow you to purchase during low-cost periods and store feed when prices are favourable. Maize prices typically drop 20-30% immediately after harvest season, while fish meal prices fluctuate based on fishing seasons and import schedules.
You can reduce feed costs significantly by understanding local supplier networks and their pricing patterns. Large feed mills often offer volume discounts during slow periods when they need to maintain production levels. A farmer in Kano discovered that ordering feed during the second week of each month consistently saved him 8-12% compared to end-of-month purchases when other farmers were restocking simultaneously.
Feed Cost Optimisation Strategies
- Seasonal purchasing: Buy feed ingredients during harvest seasons when prices drop 20-30%
- Supplier relationship management: Negotiate volume discounts and payment terms with multiple suppliers
- Quality vs. cost analysis: Track feed conversion ratios to identify the most cost-effective feed options
- Storage optimisation: Invest in proper storage to take advantage of bulk purchasing opportunities
- Alternative ingredient sourcing: Identify local protein sources that can supplement commercial feeds
Feed quality analysis through market insights helps you avoid the false economy of cheap, low-quality feed. Tracking feed conversion ratios—how much feed produces one kilo of fish—reveals which feeds deliver the best value despite higher upfront costs. A feed costing ₦180 per bag with a 1.3:1 conversion ratio delivers better value than feed costing ₦150 per bag with a 1.8:1 conversion ratio.
Water Usage Efficiency Techniques
Water costs vary dramatically across African regions, and market insights help you understand both direct costs and opportunity costs of water usage in your operation. In water-scarce regions like northern Nigeria, efficient water management can reduce operational costs by 15-25% while improving fish health and growth rates. Understanding local water pricing patterns helps you optimise usage during lower-cost periods.
Recirculating aquaculture systems (RAS) represent a significant upfront investment but can reduce water costs by 90% compared to traditional pond systems. Market analysis helps you determine whether RAS investment makes financial sense based on your local water costs, available space, and target production volumes. A farmer in Abuja calculated that RAS would pay for itself within 18 months based on local water costs of ₦45 per cubic metre.
| Water Management System | Water Usage | Setup Cost | Monthly Savings |
|---|---|---|---|
| Traditional Ponds | 100% baseline | ₦500,000 | ₦0 |
| Partial Recirculation | 40% of baseline | ₦850,000 | ₦25,000 |
| Full RAS | 10% of baseline | ₦1,800,000 | ₦65,000 |
| Biofloc System | 15% of baseline | ₦1,200,000 | ₦45,000 |
Water quality management through market insights also reduces costs by preventing disease outbreaks and mortality events that destroy months of investment. Understanding which water treatment products offer the best value, when to apply them, and how to maintain optimal conditions prevents the catastrophic losses that can eliminate an entire season's profits.
Reducing Overheads Through Market Analysis
Market analysis reveals overhead reduction opportunities that many farmers overlook because they focus only on direct production costs. Labour costs can be optimised by understanding seasonal availability and wage patterns in your region. During harvest seasons for crops, agricultural labour becomes expensive and scarce, but during off-seasons, you can often negotiate better rates for pond construction, maintenance, and other labour-intensive activities.
Transportation costs represent a significant overhead that market insights can help optimise. Understanding delivery schedules, fuel price patterns, and route efficiency helps you minimise transportation expenses while maintaining reliable market access. A farmer in Oyo State reduced transportation costs by 30% by coordinating deliveries with three neighbouring farmers, sharing truck costs while maintaining individual pricing negotiations.
Overhead Reduction Opportunities
- Labour cost timing: Schedule major projects during agricultural off-seasons when labour is 20-40% cheaper
- Shared transportation: Coordinate with neighbouring farms to reduce delivery costs by 25-35%
- Bulk purchasing: Group orders for equipment, supplies, and services to negotiate volume discounts
- Energy efficiency: Time energy-intensive operations during off-peak hours when electricity rates are lower
- Insurance optimisation: Compare coverage options annually and adjust based on actual risk patterns
Energy costs can be reduced through market analysis of utility pricing patterns and alternative energy options. Many African countries have time-of-use electricity pricing where rates are significantly lower during off-peak hours. Running aerators, pumps, and other equipment during these periods can reduce electricity costs by 20-40% without affecting fish health or growth rates.
Setting and Tracking Key Performance Indicators (KPIs)
You cannot improve what you don't measure, and in fish farming, the right KPIs reveal exactly which aspects of your operation generate profits and which drain resources. Most farmers track production metrics—fish weight, feed conversion, mortality rates—but ignore the business metrics that determine whether those healthy fish translate into healthy bank balances. The most successful farmers track both production and business KPIs to optimise their entire operation.
KPIs serve as your business dashboard, providing early warning signals when performance deviates from profitable patterns. A declining feed conversion ratio might indicate feed quality issues, while dropping average selling prices could signal market timing problems or competitive pressure. When you track the right metrics consistently, you can identify and address problems before they become expensive disasters.
The key is selecting KPIs that directly correlate with profitability rather than just operational activity. Tracking total fish produced means nothing if you can't sell them profitably, but tracking profit per square metre of pond space reveals which production strategies generate the best returns on your investment. Your KPI selection should reflect your business priorities and provide actionable insights for decision-making.
Essential KPIs for Fish Farm Profitability
Revenue per kilo represents your most important profitability KPI because it reflects both your pricing strategy and market positioning effectiveness. This metric should be tracked by species, size category, and sales channel to identify which combinations generate the highest returns. A farmer in Lagos discovered that selling 800g catfish directly to restaurants generated ₦1,350 per kilo compared to ₦950 per kilo through wholesale markets—a 42% difference that justified the extra marketing effort.
Feed conversion ratio (FCR) directly impacts your cost structure and should be monitored weekly to identify trends before they affect profitability. An FCR of 1.5:1 means you need 1.5kg of feed to produce 1kg of fish, while an FCR of 2.0:1 indicates either feed quality issues, fish health problems, or feeding management errors. Tracking FCR trends helps you optimise feeding strategies and identify the most cost-effective feed options.
Critical Profitability KPIs
- Revenue per kilo: Average selling price across all sales channels and fish sizes
- Feed conversion ratio: Kilos of feed required to produce one kilo of fish
- Profit margin per batch: Net profit as percentage of total production costs
- Mortality rate: Percentage of fish lost during each production cycle
- Days to market size: Time required to reach target selling weight
- Cost per kilo produced: Total production costs divided by kilos harvested
Mortality rate affects both your costs and revenues, making it a critical KPI for profitability analysis. A 5% mortality rate might seem acceptable, but if those fish died near harvest size, you've lost significant feed investment and potential revenue. Tracking mortality by growth stage helps you identify the most costly loss periods and implement targeted interventions to protect your investment.
Creating a KPI Dashboard for Real-Time Monitoring
Your KPI dashboard should provide immediate visibility into the metrics that matter most to your profitability, updated frequently enough to enable timely decision-making. A simple spreadsheet can serve as an effective dashboard if it's designed for quick interpretation and regular updates. The key is visual clarity—you should be able to assess your farm's performance within 30 seconds of looking at your dashboard.
Digital dashboard tools like Google Data Studio, Microsoft Power BI, or specialised aquaculture software can automate data collection and provide real-time updates on your key metrics. These platforms can pull data from multiple sources—sales records, feed purchase receipts, mortality logs—and present integrated views of your operation's performance. A farmer in Ghana using automated dashboards reduced his weekly reporting time from 4 hours to 15 minutes while improving data accuracy.
Visual Guide: KPI Dashboard Layout
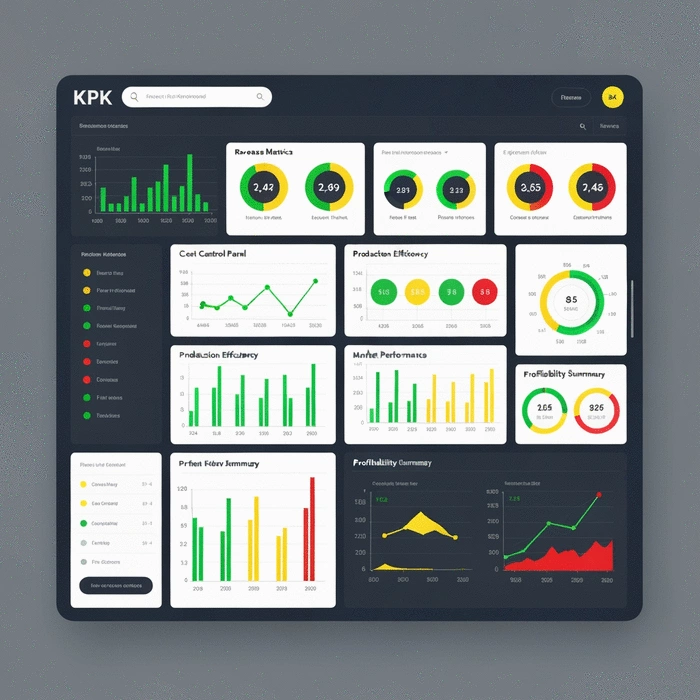
Dashboard Components Explained:
1. Revenue Metrics Section
What it shows: Current revenue per kilo, monthly sales totals, year-over-year comparisons
Why it matters to you: Immediate visibility into pricing performance and sales trends
What to watch for: Declining revenue per kilo that indicates pricing or quality issues
2. Cost Control Panel
What it shows: Feed costs, labour expenses, overhead tracking with budget comparisons
Why it matters to you: Early warning when costs exceed profitable levels
What to watch for: Cost increases that outpace revenue growth, reducing profit margins
3. Production Efficiency Indicators
What it shows: Feed conversion ratios, mortality rates, growth rates by pond or batch
Why it matters to you: Operational metrics that directly impact profitability
What to watch for: Declining efficiency that increases production costs per kilo
4. Market Performance Tracker
What it shows: Sales channel performance, customer satisfaction, market share indicators
Why it matters to you: Understanding which sales strategies generate best returns
What to watch for: Shifts in market preferences that require production adjustments
5. Profitability Summary
What it shows: Net profit margins, return on investment, cash flow projections
Why it matters to you: Overall business health and financial sustainability
What to watch for: Declining profitability trends that require strategic changes
Dashboard design should prioritise the metrics that require immediate attention when they deviate from target ranges. Use colour coding—green for on-target performance, yellow for caution zones, red for immediate attention required. This visual system allows you to identify problems quickly and focus your attention on the areas that need intervention most urgently.
Adjusting Strategies Based on KPI Performance
KPI monitoring becomes valuable only when you act on the insights it provides. When your feed conversion ratio increases beyond acceptable levels, you need predetermined response strategies—checking feed quality, adjusting feeding schedules, investigating fish health issues, or switching suppliers. Having response protocols prevents delays that can turn minor problems into major losses.
Revenue per kilo declining below target levels should trigger immediate market analysis to understand whether the problem stems from your pricing strategy, market conditions, or competitive pressure. If market prices have dropped generally, you might need to reduce costs or find premium market segments. If only your prices are declining, you might have quality issues or need better market positioning.
| KPI Alert | Possible Causes | Immediate Actions | Strategic Adjustments |
|---|---|---|---|
| FCR Increasing | Feed quality, fish health, overfeeding | Test feed, check fish behaviour, adjust feeding | Change suppliers, modify feeding protocols |
| Revenue/Kilo Dropping | Market conditions, quality issues, timing | Market research, quality assessment, buyer feedback | Pricing strategy, market positioning, sales channels |
| Mortality Rising | Disease, water quality, stress factors | Water testing, fish health check, environment audit | System upgrades, stocking density, health protocols |
| Costs Exceeding Budget | Input price increases, inefficiencies, waste | Cost analysis, supplier negotiations, waste audit | Operational efficiency, supplier diversification |
The most successful farmers use KPI trends to make proactive adjustments rather than reactive responses. If your mortality rate shows an upward trend over several weeks, even if it's still within acceptable ranges, investigate potential causes before losses become significant. This proactive approach prevents small problems from becoming expensive disasters that eliminate entire season's profits.
Developing Marketing Strategies Based on Market Insights
Your marketing strategy determines whether you sell fish at commodity prices or command premium rates for the same product. Market insights reveal which marketing messages resonate with different buyer segments, which sales channels generate the highest margins, and how to position your fish to justify higher prices. Without this intelligence, you're competing solely on price—a strategy that leads to razor-thin margins and constant pressure to cut costs.
Effective marketing in fish farming isn't about flashy advertisements or expensive promotional campaigns. It's about understanding what your buyers value most and communicating how your fish delivers that value better than alternatives. Some buyers prioritise freshness, others focus on consistent supply, and still others value sustainable production methods. Market insights help you identify these preferences and tailor your approach accordingly.
The farmers achieving premium prices aren't necessarily producing better fish—they're marketing their fish more effectively to buyers who value what they offer. A farmer selling identical catfish might earn ₦900 per kilo through generic wholesale channels while another earns ₦1,300 per kilo by marketing directly to restaurants that value consistent quality and reliable delivery schedules. Learning from inspiring journeys of African fish farmers can provide valuable insights into effective marketing strategies.
Crafting Targeted Marketing Campaigns
Market segmentation based on buyer behaviour insights allows you to create targeted marketing messages that resonate with specific customer groups. Restaurant owners care about consistent quality, reliable delivery, and competitive pricing, while individual consumers might prioritise freshness, local production, or sustainable farming practices. Your marketing approach should address the specific concerns and preferences of each segment.
A farmer in Kumasi increased his average selling price by 28% by developing separate marketing strategies for different buyer segments. For restaurants, he emphasised consistent sizing, reliable delivery schedules, and volume discounts. For individual consumers at weekend markets, he highlighted freshness, local production, and personal service. The same fish commanded different prices because the marketing addressed what each segment valued most.
Buyer Segment Marketing Strategies
- Restaurants/Hotels: Emphasise consistency, reliability, volume pricing, and professional service
- Retail Markets: Focus on freshness, competitive pricing, attractive presentation, and quick turnover
- Individual Consumers: Highlight quality, local production, sustainable practices, and personal relationships
- Processors: Stress volume capacity, consistent supply, quality specifications, and competitive pricing
- Export Markets: Emphasise quality certifications, traceability, and international standards compliance
Your marketing messages should be specific and measurable rather than generic claims. Instead of saying "high quality fish," specify "fish harvested within 24 hours of delivery" or "consistent 800g-1.2kg sizing for portion control." These specific benefits address real buyer concerns and justify premium pricing better than vague quality claims that every farmer makes.
Leveraging Social Media and Online Platforms
Social media platforms provide cost-effective ways to reach buyers directly and build relationships that support premium pricing. WhatsApp Business allows you to maintain direct communication with restaurant owners, sending them photos of available fish, confirming delivery schedules, and receiving immediate feedback on quality and service. This direct communication builds trust and loyalty that translates into consistent sales at better prices.
Facebook and Instagram can showcase your farming practices, highlight product quality, and build brand recognition among consumers who value transparency in food production. A farmer in Lagos built a following of 2,500 people by posting weekly updates about his farming practices, fish growth progress, and harvest activities. This transparency allowed him to sell directly to consumers at prices 35% higher than wholesale rates.
| Platform | Best For | Content Strategy | Expected Results |
|---|---|---|---|
| WhatsApp Business | Direct B2B communication | Product updates, delivery coordination, order management | Higher customer retention, premium pricing |
| Consumer education and branding | Farm stories, production transparency, customer testimonials | Brand recognition, direct sales opportunities | |
| Visual storytelling | High-quality photos, behind-scenes content, harvest videos | Premium positioning, younger demographics | |
| B2B networking | Industry insights, business updates, professional connections | Commercial partnerships, export opportunities |
Building Relationships with Local Distributors and Retailers
Strong relationships with distributors and retailers create stable sales channels that reduce your marketing costs and provide predictable revenue streams. These relationships require consistent quality, reliable delivery, and fair pricing, but they offer significant advantages over constantly seeking new buyers. A farmer with established distributor relationships can focus on production optimisation rather than daily sales activities.Distributor relationships work best when structured as partnerships rather than simple buyer-seller transactions. Share market insights with your distributors, help them understand seasonal demand patterns, and work together to identify new market opportunities. A farmer in Oyo State increased his sales volume by 60% by helping his distributor identify underserved market segments and adjusting production to meet those specific needs.
Relationship Building Strategies
- Consistent quality delivery: Meet agreed specifications and delivery schedules without exception
- Market intelligence sharing: Provide distributors with insights about demand trends and opportunities
- Flexible payment terms: Offer payment schedules that support distributor cash flow management
- Exclusive territory agreements: Provide distributors with protected markets in exchange for volume commitments
- Joint marketing support: Collaborate on promotional activities and market development initiatives
The most successful farmer-retailer relationships involve regular communication about market conditions, customer feedback, and inventory needs. Weekly check-ins help you understand which products are selling well, which sizes are in highest demand, and how market preferences might be changing. This information helps you adjust production planning to maintain optimal inventory levels and avoid oversupply or shortages that hurt both parties' profitability.
Summary Table:
| Key Points | Details |
|---|---|
| Understanding Market Insights | Market insights provide critical knowledge on buyer behavior and trends. This information helps farmers avoid costly mistakes in production timing. Without this, you risk underpricing or oversupplying, leading to losses. Tracking demand patterns can save you from losing thousands of naira from poorly timed harvests. |
| Importance of Market Data | Tracking price trends can increase selling price by 35% when aligned with demand peaks. Ignoring this data can lead to missed revenue opportunities. A farmer who harvests at the wrong time risks losing ₦50,000 in potential earnings. |
| Optimizing Operational Costs | Understanding feed cost cycles allows for purchases during low periods, potentially saving 20-30%. Not using this knowledge can result in overspending on feed, diminishing profit margins significantly. |
| Setting and Tracking KPIs | KPIs like revenue per kilo and feed conversion ratio give insights into operational efficiency. Failing to track these can result in undetected issues leading to profit loss. A decline in KPIs requires immediate action to avoid significant financial impact. |
| Developing Marketing Strategies | Tailored marketing strategies based on consumer insights can command higher prices. Without understanding buyer preferences, farmers may end up selling at lower commodity rates, missing out on potential profits of ₦400 or more per kilo. |
Conclusion
You now understand how market insights transform fish farming from guesswork into strategic business decisions. The difference between earning ₦800 per kilo and ₦1,200 per kilo lies in understanding your buyers, timing your production, and positioning your fish where demand is strongest.
Market insights help you avoid the costly mistakes that eliminate entire seasons' profits. When you track price patterns, understand seasonal demand, and monitor buyer preferences, you can plan production cycles that align with profitable opportunities rather than hoping your harvest timing works out.
Technology makes market analysis accessible and affordable for farms of any size. Simple spreadsheets can track essential metrics, while farm management software provides deeper insights that guide production decisions. The key is starting with metrics that directly impact your profitability rather than collecting data that doesn't inform business decisions.
Cost optimisation through market intelligence often provides bigger profit improvements than revenue increases. Understanding feed price cycles, water usage efficiency, and overhead reduction opportunities can improve your margins by 15-25% without changing your selling prices.
Your KPI dashboard should focus on metrics that predict profitability problems before they become expensive disasters. Revenue per kilo, feed conversion ratios, and mortality rates provide early warning signals when your operation deviates from profitable patterns.
Marketing strategies based on market insights help you command premium prices for the same fish that others sell at commodity rates. Understanding what different buyer segments value most allows you to position your fish appropriately and build relationships that support consistent sales at better prices.
Start by tracking one key metric that affects your profitability—perhaps average selling price by harvest timing or feed conversion ratios by supplier. Build your market intelligence gradually, focusing on insights that guide immediate business decisions rather than academic understanding.
The farmers consistently earning the highest profits aren't necessarily the best fish producers—they're the ones who understand their markets best and make production decisions based on business intelligence rather than assumptions.
Frequently Asked Questions
What are market insights in fish farming?
Market insights are actionable intelligence about your buyers, competitors, and market conditions that help you make profitable business decisions. They involve understanding who buys fish in your area, what they're willing to pay, when they buy most, and the factors influencing their purchasing decisions.
Why are market insights important for fish farm profitability?
Market insights help you bridge the gap between successful production and profitable business outcomes. By understanding demand patterns, seasonal trends, and buyer preferences, you can time your production and sales to capitalise on peak prices, reduce costs, and avoid market gluts, ultimately increasing your profit margins.
What types of market data should fish farmers track?
You should track several types of market data, including price trends (historical and current), demand patterns (which species, sizes, and qualities are preferred), consumer behaviour (when and why people buy), competitive intelligence (what other farmers are doing), and supply chain insights (how fish move to consumers).
How can technology help fish farmers analyse market insights?
Technology, such as farm management software, big data, and AI, can revolutionise market analysis. These tools help you track prices, predict demand fluctuations, optimise harvest timing, and monitor competitors with greater accuracy and speed than manual methods, leading to better decision-making and increased profits.
What are some key performance indicators (KPIs) for tracking fish farm profitability?
Essential KPIs for fish farm profitability include revenue per kilo, feed conversion ratio (FCR), profit margin per batch, mortality rate, days to market size, and cost per kilo produced. Tracking these metrics provides a clear dashboard of your farm's financial health and operational efficiency.

Yomi Adisa Lead Researcher
Yomi Adisa is the lead researcher at Fish Farming Business, where he studies what makes aquaculture ventures profitable across Africa. His research focuses on market patterns, buyer preferences, and the business decisions that determine success or failure in fish farming.


