

Improving Feed Conversion Ratio in Fish Farming: Practical Guide to Cutting Costs and Boosting Profits

Posted on: 2025-11-06
By: Yomi Adisa
You've invested months raising healthy fish, only to discover your feed costs are eating into every naira of profit. A farmer in Lagos recently told us he was spending ₦180,000 monthly on feed but only earning ₦200,000 from fish sales—leaving him with barely ₦20,000 after other expenses. His Feed Conversion Ratio (FCR) was costing him his business, and he didn't even know what FCR meant.
Feed Conversion Ratio determines how efficiently your fish convert feed into body weight. When your FCR improves from 2.0 to 1.5, you're suddenly using 25% less feed to produce the same amount of fish. For a medium-scale farm producing 2,000kg monthly, that's the difference between spending ₦240,000 and ₦180,000 on feed—saving you ₦60,000 every month.
In this guide, you'll discover how to calculate your current FCR, identify the factors destroying your feed efficiency, and implement practical strategies that successful farmers across Nigeria and Ghana use to cut feed costs whilst boosting growth rates. You'll learn why water temperature affects your feed budget, how feeding schedules can save you thousands monthly, and which locally available feed additives deliver measurable improvements to your bottom line.
By the end, you'll understand exactly why some farmers achieve FCR rates of 1.3 whilst others struggle with 2.5—and more importantly, you'll know which specific changes will move your farm from the struggling category into the profitable one.
What You Will Learn
- How to calculate your current Feed Conversion Ratio (FCR) and understand its significance.
- Strategies to identify and mitigate factors that negatively impact feed efficiency.
- Effective feeding schedules tailored to different fish sizes for optimal growth.
- Insights on the role of water quality and environmental conditions in improving FCR.
- Cost-effective feed additives and probiotics that can enhance nutrient absorption.
- How technological innovations can streamline FCR monitoring and management.
Understanding Feed Conversion Ratio (FCR)
Feed Conversion Ratio represents the foundation of profitable fish farming, yet most farmers never calculate it properly. You're essentially measuring how many kilograms of feed your fish need to gain one kilogram of body weight. When you understand this number, you can predict your feed costs, compare different feeding strategies, and identify exactly where your money is disappearing.
The mathematics are straightforward, but the business implications run deep. A farm with poor FCR might spend ₦300,000 on feed to produce 1,000kg of fish, whilst an efficient operation spends only ₦200,000 for the same output. That ₦100,000 difference accumulates month after month, determining whether you're building wealth or barely surviving.
Most importantly, FCR gives you a concrete way to measure improvements. When you change your feeding schedule, switch feed brands, or adjust water quality, understanding FCR calculations tells you immediately whether these changes are saving money or costing you more.
Definition of Feed Conversion Ratio (FCR)
Feed Conversion Ratio measures the efficiency with which your fish convert feed into body weight gain. You calculate FCR by dividing the total amount of feed consumed by the total weight gain of your fish over a specific period. An FCR of 1.5 means your fish need 1.5kg of feed to gain 1kg of body weight.
Lower FCR numbers indicate better efficiency and higher profitability. If your catfish achieve an FCR of 1.3, they're converting feed more efficiently than fish with an FCR of 2.0. This difference directly impacts your feed costs—the largest expense in most fish farming operations.
FCR Calculation Formula
FCR = Total Feed Given (kg) ÷ Total Weight Gain (kg)
Example: If you feed 150kg of feed and your fish gain 100kg in weight, your FCR is 1.5
Importance of FCR in Fish Farming
FCR directly determines your profitability because feed typically represents 60-70% of your total production costs. When your FCR improves from 2.0 to 1.6, you're reducing feed costs by 20% whilst maintaining the same fish production. For a farm producing 1,500kg monthly, this improvement saves approximately ₦48,000 in feed costs every month.
You need to understand that FCR affects more than just feed expenses. Poor FCR often indicates underlying problems—inadequate water quality, inferior feed, or suboptimal feeding practices. These same issues typically slow growth rates, extend production cycles, and increase mortality risks.
Nigerian farmers consistently report that monitoring FCR helps them identify problems before they become costly disasters. When FCR suddenly increases from 1.4 to 1.8, it signals that something has changed in your system—perhaps water quality has deteriorated, feed quality has declined, or fish are becoming stressed.
Calculating FCR
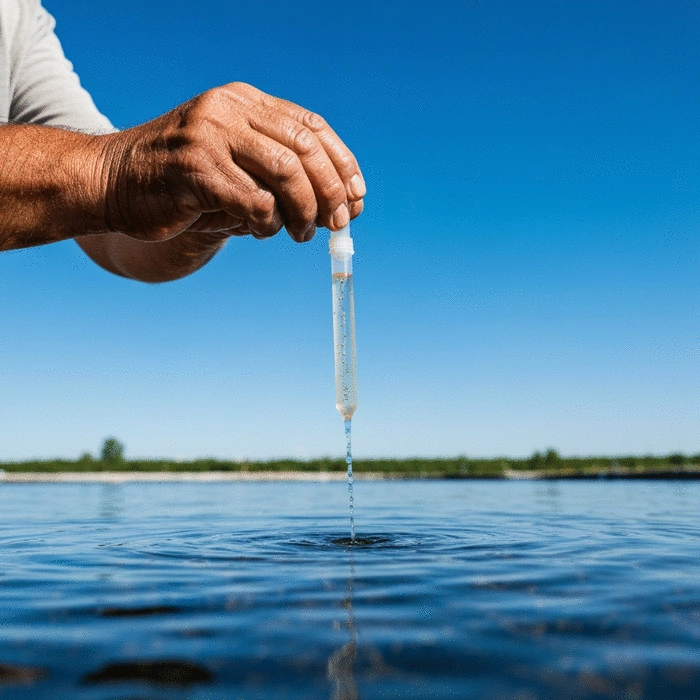
You need accurate records of feed input and fish weight changes to calculate meaningful FCR values. Start by weighing a representative sample of your fish at the beginning of your measurement period—typically monthly intervals work best for practical management. Record the total weight of feed given during this period, including any wastage you can measure.
At the end of your measurement period, weigh the same fish sample and calculate the average weight gain per fish. Multiply this by your total fish population to estimate total weight gain for your pond. Divide total feed consumed by total weight gain to get your FCR.
Here's a practical example from a catfish farm in Ogun State: Starting weight of 1,000 fingerlings was 50kg total. After one month, they weighed 180kg total, representing 130kg weight gain. The farmer used 195kg of feed during this period. FCR calculation: 195kg feed ÷ 130kg weight gain = 1.5 FCR.
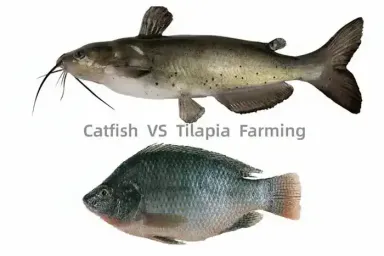
| Fish Species | Typical FCR Range | Good FCR Target |
|---|---|---|
| Catfish (Clarias) | 1.2 - 2.0 | 1.3 - 1.5 |
| Tilapia | 1.4 - 2.2 | 1.5 - 1.7 |
| Carp | 1.8 - 2.5 | 1.8 - 2.0 |
Remember that stocking density significantly affects your FCR calculations. Overcrowded ponds typically show higher FCR values because fish compete for feed and experience stress that reduces feed efficiency. You want to account for this when comparing FCR across different ponds or production cycles.
Factors Affecting FCR in Fish Farming
Your FCR doesn't exist in isolation—it responds to every decision you make about feed quality, feeding schedules, and pond management. A farmer in Kaduna discovered this when his FCR jumped from 1.4 to 2.1 after switching to cheaper feed, costing him an extra ₦85,000 monthly in feed expenses. Understanding these factors helps you predict how changes will affect your feed efficiency before they impact your profits.
The relationship between these factors is interconnected. Poor water quality reduces appetite, which leads to feed wastage and higher FCR. Inconsistent feeding schedules stress fish, making them convert feed less efficiently. Low-quality feed forces you to give more feed to achieve the same growth, directly increasing your FCR.
Most importantly, you can control these factors. Unlike market prices or weather patterns, feed quality, feeding practices, and environmental conditions are management decisions that directly determine whether your FCR stays profitable or destroys your margins.
Feed Quality and Composition
Feed quality represents the single most important factor affecting your FCR, yet many farmers focus only on price per bag rather than nutritional value. High-quality feed with proper protein levels, essential amino acids, and digestible ingredients allows fish to convert nutrients efficiently into body weight. Poor-quality feed forces fish to consume more to meet their nutritional needs, directly increasing your FCR.
You need to understand that protein content alone doesn't determine feed quality. A feed with 35% crude protein but poor digestibility will produce worse FCR than a 32% protein feed with high-quality ingredients. Fish meal, soybean meal, and other premium ingredients cost more initially but often deliver better FCR, reducing your overall feed costs per kilogram of fish produced.
Local feed mills across Nigeria and Ghana now offer various formulations, but quality varies significantly. Feeds stored improperly lose nutritional value, develop moulds, or become rancid—all factors that worsen FCR. You want to source feed from reputable suppliers, store it properly in dry conditions, and use it within recommended timeframes to maintain optimal FCR performance.
Feeding Practices and Schedules
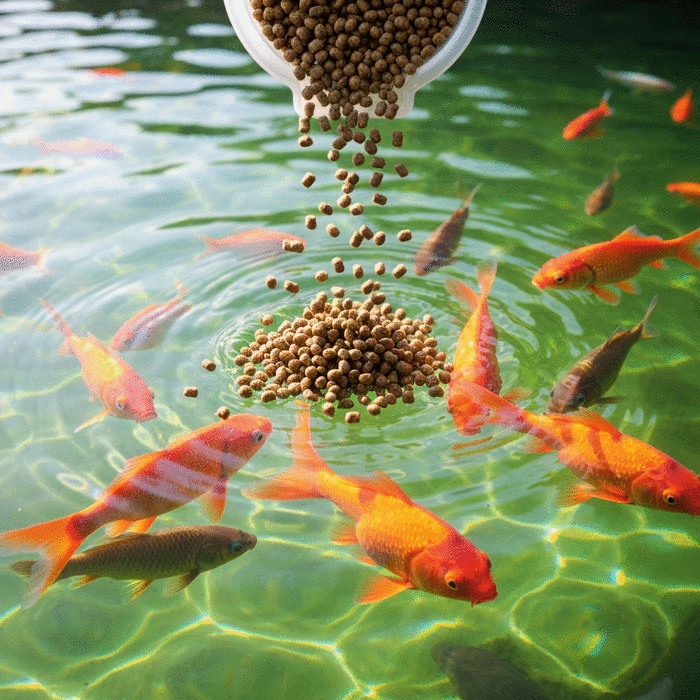
Your feeding schedule directly impacts how efficiently fish convert feed into growth. Fish have optimal feeding times based on their natural behaviour and water temperature. Catfish, for example, feed most actively during early morning and late evening hours. Feeding during these peak periods improves feed utilisation and reduces wastage that increases FCR.
Feeding frequency matters more than most farmers realise. Young fish require multiple small meals daily for optimal FCR, whilst larger fish can efficiently process fewer, larger meals. A common mistake is feeding adult fish too frequently or juvenile fish too infrequently—both practices worsen FCR and increase feed costs unnecessarily.
Overfeeding represents the fastest way to destroy your FCR. When you give more feed than fish can consume within 15-20 minutes, the excess sinks to the pond bottom, decomposes, and pollutes water whilst contributing nothing to fish growth. A farmer in Ibadan reduced his FCR from 1.9 to 1.4 simply by adjusting feeding quantities to match fish appetite rather than following rigid schedules.
Optimal Feeding Guidelines
- Fingerlings (under 50g): Feed 4-5 times daily, 8-10% of body weight
- Juveniles (50-200g): Feed 3-4 times daily, 5-6% of body weight
- Adults (over 200g): Feed 2-3 times daily, 3-4% of body weight
- Feed timing: Early morning (6-7 AM) and late evening (5-6 PM) for best FCR
Environmental Conditions
Water quality parameters directly influence your fish's ability to digest feed and convert nutrients efficiently. When dissolved oxygen levels drop below 4mg/L, fish reduce feeding activity and digest food less efficiently, immediately increasing your FCR. Temperature fluctuations stress fish and slow their metabolism, requiring more feed to achieve the same growth rates.
You need to monitor pH levels because extreme values affect nutrient absorption. Catfish perform best at pH 6.5-8.5, whilst tilapia prefer 7.0-8.5. When pH moves outside these ranges, fish struggle to extract nutrients from feed, forcing you to give more feed for the same weight gain. This directly increases your FCR and feed costs.
Ammonia and nitrite levels represent hidden FCR destroyers. Even low levels that don't kill fish can reduce appetite and impair digestion. A pond with 0.5mg/L ammonia might show FCR of 1.8, whilst the same pond with proper water quality management achieves 1.4 FCR. The difference costs you approximately ₦40,000 monthly on a medium-scale farm producing 1,500kg of fish.
| Water Parameter | Optimal Range | FCR Impact When Poor |
|---|---|---|
| Dissolved Oxygen | 5-8 mg/L | +0.3 to +0.5 FCR increase |
| Temperature | 26-30°C | +0.2 to +0.4 FCR increase |
| pH Level | 6.5-8.5 | +0.2 to +0.3 FCR increase |
| Ammonia | Below 0.1 mg/L | +0.4 to +0.6 FCR increase |
Stocking density affects FCR through competition and stress. When you stock too many fish per cubic metre, they compete aggressively for feed, leading to uneven growth and poor feed utilisation. Stressed fish also produce more waste, degrading water quality and creating a cycle that continuously worsens FCR. You want to maintain appropriate stocking densities—typically 50-80 fish per cubic metre for catfish, depending on your management system and aeration capacity.
Practical Strategies to Improve FCR
You can dramatically improve your FCR through targeted strategies that address feed quality, management practices, and biological enhancement. These aren't theoretical concepts—they're proven methods that farmers across Nigeria, Ghana, and Kenya use to reduce feed costs by 20-30% whilst maintaining or increasing production levels. The key lies in understanding which interventions deliver the biggest impact for your specific operation.
Most farmers approach FCR improvement backwards, focusing on minor adjustments rather than the factors that drive major improvements. You want to prioritise changes that offer the highest return on investment. Switching from poor-quality feed to premium feed might cost ₦50 more per bag but save you ₦150 in reduced feed consumption. Adding probiotics might cost ₦15,000 monthly but reduce your overall feed bill by ₦45,000.
The strategies below work synergistically—combining improved feed with better management practices and biological enhancers typically delivers FCR improvements of 0.4-0.6 points. For a farm producing 2,000kg monthly, this translates to feed savings of ₦80,000-₦120,000 every month.
Optimising Feed Types and Formulations
You need to evaluate feed based on FCR performance rather than price per bag. A feed costing ₦8,500 per bag that delivers 1.4 FCR is more profitable than a ₦7,000 feed producing 1.8 FCR. Calculate your cost per kilogram of fish produced—this reveals the true economics of different feed options and guides better purchasing decisions.
Protein quality matters more than protein percentage. Feeds using fish meal and soybean meal as primary protein sources typically deliver better FCR than those relying heavily on blood meal or feather meal. You want to examine ingredient lists and choose feeds with digestible protein sources, even if they cost slightly more initially.
Local feed mills across West Africa now offer customised formulations for different growth stages. Starter feeds with higher protein content (40-45%) support rapid early growth and better FCR in fingerlings. Grower feeds (32-35% protein) optimise FCR for juvenile fish, whilst finisher feeds (28-30% protein) maintain good FCR whilst reducing feed costs for market-size fish.
Feed Selection Criteria for Better FCR
- Protein digestibility: Look for feeds with fish meal or soybean meal as primary protein sources
- Pellet quality: Well-formed pellets reduce wastage and improve water stability
- Fat content: 8-12% fat content supports growth without compromising FCR
- Storage conditions: Choose suppliers with proper storage facilities to maintain feed quality
Enhancing Feeding Management Techniques
Your feeding schedule directly determines FCR performance, yet most farmers use rigid schedules that ignore fish behaviour and environmental conditions. You want to adjust feeding frequency based on fish size, water temperature, and appetite response. During cooler months, reduce feeding frequency as fish metabolism slows. During peak growth periods, increase feeding frequency to maximise nutrient utilisation.
Feed presentation affects FCR significantly. Scatter feeding across the pond surface ensures all fish access feed and reduces competition that leads to uneven growth. Concentrated feeding in one area creates aggressive competition, stress, and poor feed utilisation. You want to distribute feed evenly and observe fish response to determine optimal feeding rates.
Timing your feeding sessions improves FCR by aligning with natural feeding patterns. Catfish feed most actively during dawn and dusk hours when dissolved oxygen levels are typically higher. Feeding during midday heat often results in poor appetite and feed wastage. A farmer in Ogun State improved his FCR from 1.7 to 1.3 by shifting feeding times to early morning (6 AM) and late evening (6 PM).
| Fish Size | Feeding Frequency | Daily Feed Rate | Expected FCR |
|---|---|---|---|
| Fingerlings (5-50g) | 4-5 times daily | 8-10% body weight | 1.2-1.4 |
| Juveniles (50-200g) | 3-4 times daily | 5-6% body weight | 1.3-1.5 |
| Adults (200g+) | 2-3 times daily | 3-4% body weight | 1.4-1.6 |
Monitor fish response during feeding to optimise quantities. Fish should consume feed within 15-20 minutes of application. If feed remains after 30 minutes, you're overfeeding and worsening your FCR. If fish consume feed within 5 minutes and continue searching, you might benefit from slightly larger portions or additional feeding sessions.
Utilising Probiotics and Feed Additives
Probiotics improve FCR by enhancing digestive efficiency and nutrient absorption in fish. These beneficial bacteria colonise the fish gut, improving feed digestion and reducing the amount of feed needed for growth. Nigerian farmers report FCR improvements of 0.2-0.4 points when using quality probiotic supplements consistently.
You can source probiotics locally or add them to feed during preparation. Commercial probiotic products cost approximately ₦12,000-₦18,000 per month for a 1,000-fish pond but typically reduce feed costs by ₦35,000-₦50,000 monthly through improved FCR. The return on investment makes probiotics one of the most cost-effective FCR improvement strategies.
Digestive enzymes represent another powerful FCR enhancer. These supplements help fish break down complex nutrients more efficiently, particularly in feeds with plant-based proteins that are naturally harder to digest. Enzyme supplements cost about ₦8,000 monthly per 1,000 fish but can improve FCR by 0.1-0.3 points.
Effective Feed Additives for FCR Improvement
- Probiotics: Improve gut health and nutrient absorption (₦12,000-₦18,000/month)
- Digestive enzymes: Enhance protein and carbohydrate digestion (₦8,000/month)
- Organic acids: Reduce harmful bacteria and improve feed utilisation (₦6,000/month)
- Vitamin C: Reduces stress and improves immune function (₦4,000/month)
Organic acids like citric acid and formic acid improve FCR by creating optimal pH conditions in the fish digestive system and reducing harmful bacteria populations. You can add these acids directly to feed or water at recommended concentrations. The cost is minimal—approximately ₦6,000 monthly—but the FCR improvement often justifies this investment through reduced feed consumption.
Economic Implications of Improving FCR
The financial impact of FCR improvements extends far beyond simple feed cost reductions. When you improve FCR from 1.8 to 1.4, you're not just saving ₦60,000 monthly on feed for a 1,500kg production farm—you're also reducing production time, decreasing labour costs, and improving cash flow cycles. These combined benefits often double the apparent savings from FCR improvements.
Understanding the economics helps you prioritise which FCR improvement strategies deliver the highest returns. Some interventions require significant upfront investment but pay for themselves within two production cycles. Others offer immediate savings with minimal investment. You need to evaluate each strategy based on your current financial position and production goals.
Most importantly, FCR improvements compound over time. A farm that consistently maintains 1.4 FCR versus 1.8 FCR doesn't just save money—it produces more fish per year, builds stronger cash reserves, and creates capacity for expansion. These long-term advantages often determine which farms thrive and which ones struggle to survive market fluctuations.
Cost Savings from Improved FCR
You can calculate potential savings by comparing feed costs at different FCR levels. For a farm producing 1,500kg monthly with feed costing ₦320 per kilogram, improving FCR from 1.8 to 1.4 reduces monthly feed costs from ₦864,000 to ₦672,000—saving ₦192,000 every month. Over a full year, this represents savings of ₦2,304,000.
The savings multiply when you consider production cycle reductions. Better FCR typically correlates with faster growth rates, allowing you to harvest fish 2-4 weeks earlier. This acceleration increases your annual production cycles from 2.5 to 3.0, boosting total annual revenue by 20% whilst maintaining the same pond infrastructure and labour costs.
Cash flow improvements represent another significant benefit. When fish reach market size faster due to improved FCR, you recover your investment sooner and can reinvest profits into the next production cycle. A farmer in Kwara State used FCR improvements to reduce his production cycle from 6 months to 4.5 months, allowing him to complete three full cycles annually instead of two.
| FCR Level | Monthly Feed Cost (1,500kg production) | Annual Savings vs 2.0 FCR |
|---|---|---|
| 2.0 FCR | ₦960,000 | ₦0 (baseline) |
| 1.6 FCR | ₦768,000 | ₦2,304,000 |
| 1.4 FCR | ₦672,000 | ₦3,456,000 |
| 1.2 FCR | ₦576,000 | ₦4,608,000 |
Case Studies of Successful FCR Improvements
A catfish farm in Lagos State achieved remarkable results by implementing comprehensive FCR improvement strategies. Starting with an FCR of 2.1, the farmer invested ₦85,000 in better feed, probiotics, and water quality management. Within three months, FCR improved to 1.5, reducing monthly feed costs by ₦180,000 on a 2,000kg production operation.
The farmer's approach combined multiple strategies: switching to premium feed (₦45,000 additional monthly cost), adding probiotics (₦15,000 monthly), and improving feeding schedules (no additional cost). The total investment of ₦60,000 monthly generated savings of ₦180,000 monthly—a 200% return on investment that continues every production cycle.
Another success story comes from a tilapia farm in Ghana that focused specifically on feeding management. By adjusting feeding times to early morning and late evening, reducing feeding frequency for adult fish, and implementing portion control based on fish response, the farmer improved FCR from 1.9 to 1.4 without any additional costs. This management-only approach saved ₦95,000 monthly in feed expenses.
Key Success Factors from Case Studies
- Systematic approach: Successful farmers address multiple FCR factors simultaneously
- Consistent monitoring: Regular FCR calculations help identify what works
- Investment mindset: View FCR improvements as investments, not expenses
- Patience: Allow 4-6 weeks to see full results from FCR improvement strategies
Long-term Benefits of Optimising FCR
Sustained FCR improvements create competitive advantages that extend beyond immediate cost savings. Farms with consistently good FCR can offer competitive prices to buyers whilst maintaining healthy profit margins. This pricing flexibility helps secure long-term buyer relationships and provides buffer against market price fluctuations.
You build operational expertise through FCR optimisation that applies to all aspects of fish farming. The monitoring systems, feeding protocols, and water quality management practices that improve FCR also reduce mortality, improve growth rates, and enhance overall farm productivity. These skills compound over time, making your operation increasingly efficient and profitable.
Market positioning improves when you can reliably produce fish at lower costs. You can expand into premium markets that require consistent supply and competitive pricing. Several farmers across Nigeria have used FCR improvements to avoid financial mistakes and transition from local market sales to supplying restaurants and processing facilities that offer higher prices but demand consistent quality and delivery schedules.

Technological Innovations for Monitoring and Improving FCR
Technology is transforming how African fish farmers monitor and improve FCR, making precision management accessible to operations of all sizes. Digital tools now allow you to track feed consumption, growth rates, and environmental conditions in real-time, identifying FCR problems before they become expensive disasters. These innovations are particularly valuable because they help you make data-driven decisions rather than relying on guesswork.
The adoption of aquaculture technology across Nigeria, Ghana, and Kenya is accelerating as costs decrease and benefits become clear. Farmers who embrace these tools report FCR improvements of 0.3-0.5 points within six months of implementation. More importantly, technology helps maintain consistent FCR performance across multiple production cycles, reducing the variability that destroys profitability.
You don't need massive investment to benefit from technological innovations. Many effective tools cost less than the monthly savings they generate through improved FCR. The key is selecting technologies that address your specific challenges and integrate well with your existing management practices.
Digital Tools for FCR Tracking
Smartphone applications now enable precise FCR monitoring without expensive equipment. These apps help you record daily feed quantities, track fish weights, and calculate FCR automatically. Some applications integrate weather data and water quality readings to identify correlations between environmental conditions and FCR performance.
IoT sensors represent the next level of FCR monitoring, providing continuous data on water quality parameters that affect feed efficiency. Dissolved oxygen sensors, temperature monitors, and pH metres connected to smartphone apps alert you when conditions deteriorate before they impact FCR. A complete monitoring system costs ₦150,000-₦300,000 but typically pays for itself within one production cycle through improved FCR.
Cloud-based farm management platforms allow you to analyse FCR trends across multiple ponds and production cycles. These systems identify patterns that manual record-keeping might miss—such as seasonal FCR variations or correlations between stocking density and feed efficiency. Several Nigerian tech companies now offer aquaculture-specific platforms designed for local farming conditions.
Essential Digital Tools for FCR Management
- Feed tracking apps: Record daily feed quantities and calculate FCR automatically
- Growth monitoring tools: Track fish weights and growth rates digitally
- Water quality sensors: Monitor parameters that affect FCR in real-time
- Data analysis platforms: Identify FCR trends and improvement opportunities
Advances in Feed Technology
Precision feeding systems are becoming available for medium and large-scale operations across Africa. These automated systems deliver exact feed quantities at optimal times, reducing waste and improving FCR consistency. While initial costs range from ₦500,000-₦2,000,000, the systems typically improve FCR by 0.2-0.4 points whilst reducing labour costs significantly.
Functional feeds incorporating probiotics, enzymes, and immune enhancers are increasingly available from local feed mills. These advanced formulations cost 15-25% more than standard feeds but often deliver FCR improvements that more than offset the additional expense. You can work with local feed manufacturers to develop custom formulations optimised for your specific conditions and fish species.
Feed quality testing technology helps you verify nutritional content and freshness before use. Portable protein analysers and moisture metres cost ₦80,000-₦150,000 but help you avoid poor-quality feed that destroys FCR. Some farmers pool resources to purchase testing equipment collectively, sharing costs whilst ensuring feed quality across multiple operations.
Future Trends in Aquaculture Feed Efficiency
Artificial intelligence is beginning to influence FCR optimisation through predictive analytics and automated decision-making. AI systems analyse multiple data streams—weather patterns, water quality, fish behaviour, and growth rates—to recommend optimal feeding strategies. While still emerging, these technologies show promise for delivering consistent FCR improvements of 0.4-0.6 points.
Alternative protein sources are being developed specifically for African aquaculture markets. Insect meal, algae protein, and locally sourced plant proteins offer potential for improved FCR whilst reducing dependence on expensive imported ingredients. Several research institutions across Nigeria and Ghana are developing feeds using indigenous protein sources that could improve both FCR and affordability.
Blockchain technology is being explored for feed traceability and quality assurance. This technology could help you verify feed ingredients, storage conditions, and nutritional content throughout the supply chain. Better feed quality control directly translates to more predictable FCR performance and reduced risk of feed-related production problems.
| Technology | Current Availability | Expected FCR Impact | Investment Range |
|---|---|---|---|
| IoT Monitoring | Available now | 0.2-0.4 improvement | ₦150,000-₦300,000 |
| Automated Feeding | Limited availability | 0.3-0.5 improvement | ₦500,000-₦2,000,000 |
| AI Analytics | Emerging | 0.4-0.6 improvement | ₦200,000-₦800,000 |
| Alternative Feeds | Research phase | 0.2-0.3 improvement | Similar to current feeds |
The integration of these technologies creates opportunities for precision aquaculture that optimises FCR automatically. Smart farms that combine automated feeding, continuous monitoring, and AI-driven decision-making could achieve FCR levels of 1.1-1.3 consistently—performance that would revolutionise profitability for African fish farmers. While these integrated systems remain expensive today, costs are declining rapidly as technology adoption increases across the continent.

Summary Table
| Key Points | Details |
|---|---|
| Understanding FCR | FCR measures feed efficiency; poor FCR can lead to significant losses (up to ₦100,000 monthly) if untreated. Identify your FCR regularly to avoid large feed expenditures. |
| Impact of FCR on Profits | Improvements in FCR reduce feed costs, allowing savings of approximately ₦48,000 per month for a 1,500kg production. Tracking FCR helps identify underlying farm issues early. |
| Factors Influencing FCR | Water quality, feed quality, and feeding schedules significantly affect FCR. A farm in Kaduna faced a ₦85,000 increase in feed costs due to poor feed choice. Monitor water parameters to maintain FCR. |
| Optimising Feeding Practices | Adjust feeding schedules based on fish size and water conditions to enhance FCR. Overfeeding can worsen FCR and lead to feed wastage, which can cost thousands of naira monthly. |
| Using Probiotics and Additives | Probiotics can boost FCR by 0.2-0.4 points, offering savings of ₦35,000-₦50,000 monthly for a 1,000-fish pond. Incorporate these to enhance nutrient absorption and reduce feed costs. |
| Economic Benefits of FCR Improvement | Improving FCR can reduce monthly feed costs significantly, with potential savings reaching ₦192,000 annually per production cycle. Enhanced cash flow allows faster reinvestment into operations. |
| Technological Innovations | Digital tools and IoT sensors enhance FCR monitoring, costing ₦150,000-₦300,000 but paying for themselves through improved feed efficiencies. Early adopters gain a competitive edge. |
| Conclusion | FCR optimisation is essential for profitability; improvements lead to sustainable operations. Start by calculating your current FCR and implementing high-impact changes for immediate benefits. |
Conclusion
You now understand that FCR represents the difference between profitable fish farming and barely surviving in the market. When you improve your FCR from 1.8 to 1.4, you're not just saving ₦60,000 monthly on feed costs—you're building a sustainable operation that can weather price fluctuations and market challenges.
The strategies covered here work because they address the root causes of poor feed efficiency. Better feed quality, optimised feeding schedules, improved water management, and strategic use of probiotics all contribute to FCR improvements that compound over time. Each 0.1 improvement in FCR translates to thousands of naira in monthly savings.
Technology is making FCR monitoring and improvement more accessible to African farmers. Digital tracking tools, IoT sensors, and automated feeding systems are no longer luxuries—they're becoming essential tools for competitive operations. The farms that adopt these technologies early will have significant advantages in the coming years.
Your next step is to calculate your current FCR accurately and identify which factors are costing you the most money. Start with the highest-impact changes: evaluate your feed quality, adjust your feeding schedule, and implement basic water quality monitoring. These changes require minimal investment but deliver measurable results within 4-6 weeks.
Remember that FCR improvement is an ongoing process, not a one-time fix. The most successful farmers continuously monitor their FCR, test new strategies, and adapt their practices based on results. This commitment to efficiency separates thriving operations from those that struggle to remain profitable.
Frequently Asked Questions
What is Feed Conversion Ratio (FCR) in fish farming?
FCR measures how efficiently your fish convert feed into body weight. You calculate it by dividing the total amount of feed consumed by the total weight gained by your fish over a specific period. A lower FCR indicates better efficiency and higher profitability for your farm.
Why is FCR so important for my fish farm's profitability?
FCR directly impacts your profitability because feed is typically 60-70% of your total production costs. Improving your FCR means you use less feed to produce the same amount of fish, significantly reducing expenses. It also signals overall farm health, as poor FCR often points to underlying issues like bad water quality or inadequate feeding.
What factors significantly affect my FCR?
Several factors influence your FCR, with feed quality, feeding practices, and environmental conditions being the most critical. Poor-quality feed, overfeeding, inconsistent schedules, and suboptimal water parameters (like low dissolved oxygen or incorrect temperature) all lead to higher FCR and increased costs.
What practical strategies can I use to improve my farm's FCR?
You can improve FCR by optimising feed types and formulations, enhancing feeding management techniques, and utilising probiotics and feed additives. This includes choosing digestible feeds, adjusting feeding schedules based on fish size and water temperature, and incorporating supplements to boost digestion and nutrient absorption.
What are the economic benefits of improving FCR?
Improving FCR leads to significant cost savings on feed, which is your largest expense. Beyond that, it often results in faster growth rates, allowing for earlier harvests and more production cycles per year. This boosts overall revenue, improves cash flow, and enhances your farm's long-term competitive position.

Yomi Adisa
Yomi Adisa is the lead researcher at Fish Farming Business, where he studies what makes aquaculture ventures profitable across Africa. His research focuses on market patterns, buyer preferences, and the business decisions that determine success or failure in fish farming.


